Recovery in national house price inflation continues apace
 Dr Andrew Golding, chief executive of the Pam Golding Property group
 Encouragingly for homeowners and investors, the recovery in national house price inflation (HPI) continues to gather momentum, with the Pam Golding Residential Property Index rising to +7.3% in June 2025 , up from a revised +6.9% in May 2025. This is significantly above the two previous cyclical peaks and the strongest growth rate in national house prices since late-2007.
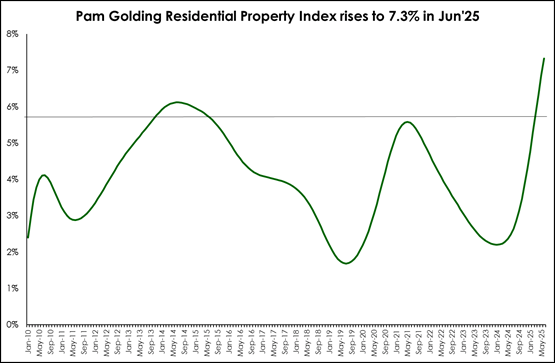
SOURCE: Pam Golding Residential Property Index
Since late-2024, consumer inflation has remained well anchored at or below the lower limit of the Reserve Bank’s 3%-6% inflation target. As a result, the recovery in national house prices has seen real (inflation-adjusted) growth in house prices increase, rising to +4.3% in June 2025, the ninth consecutive month in positive territory.
Says Dr Andrew Golding, chief executive of the Pam Golding Property group: “While the Western Cape continues to lead the way, the recovery is broad-based, with growth in house prices accelerating across all three major regional markets.”
According to the Pam Golding Residential Property Index the recovery in HPI in the Western Cape continued to accelerate in June , rising to +8.3%, while both Gauteng and KwaZulu-Natal continued to rebound strongly, rising to +5.4% and +5.1% respectively, reducing the gap with the Western Cape.
Says Dr Golding: “Reviewing the same provinces over the first half of 2025 , while national HPI has averaged +6.1%, regional performances range from +7.7% in the Western Cape to +4.25% in KwaZulu-Natal and +4.17% in Gauteng. Notably for KZN, this represents the strongest growth in house prices since 2021, while in Gauteng it matches the post-pandemic rebound.”
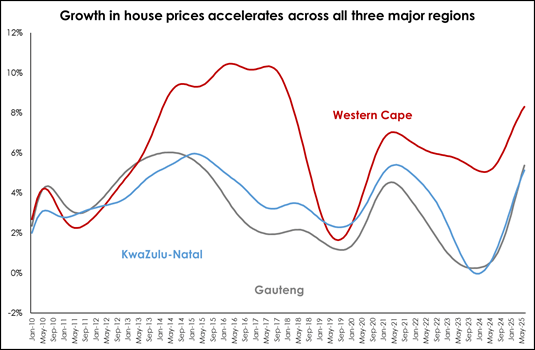
SOURCE: Pam Golding Residential Property Index
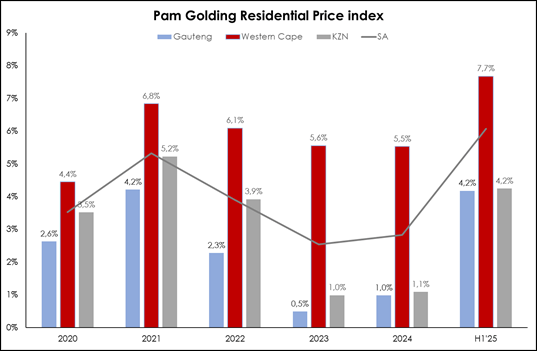
SOURCE: Pam Golding Residential Property Index
According to the Index, house price inflation in all but the upper price band continues to gather momentum. House price inflation in the price band below R1 million has outpaced growth in prices in all higher price bands since late-2024.
| National HPI | 2024 % | H1 2025 % |
| <R1 million | 2.35 | 8.59 |
| R1m – R2m | 2.26 | 5.04 |
| R2m – R3m | 3.41 | 6.65 |
| >R3m | 5.16 | 4.29 |
| Average | 2.83 | 6.07 |
SOURCE: Pam Golding Residential Property Index
Coastal vs non-coastal
House price inflation for coastal properties, which Lightstone defines as any property located within 500 metres of the coastline, continues to outpace the growth in prices for properties located further inland.
Says Dr Golding: “In June , the recovery in coastal house prices continues to outpace the rebound in non-coastal HPI, with prices rising by +6.2% and +4.2%, resulting in a widening of the coastal price premium to +2%.
“The coastal price premium has risen from a low of +1.3% in October 2024 to +2% in June , averaging 1.7% during the first half of 2025.”
Sectional title vs freehold
According to Lightstone statistics, the recovery in sectional title HPI also continues, with annual growth in prices rising by +4.2% in June , while freehold HPI rose to 5% above year-earlier levels. During H1 2025 , freehold HPI averaged 4.5% compared to 3.7% for sectional title.
Major metro housing markets
The recovery in national metro housing markets, which initially started in Cape Town, has now become broad based, with all major metro markets now registering a rebound in house prices. Notably, Cape Town continues to outperform other metro markets by a significant margin, rising by +6.9% in June , followed by +3.0% in Tshwane and +2.8% in eThekwini. This trend is also evident in H1 2025 , with Cape Town outperforming other metro markets by a wide margin.
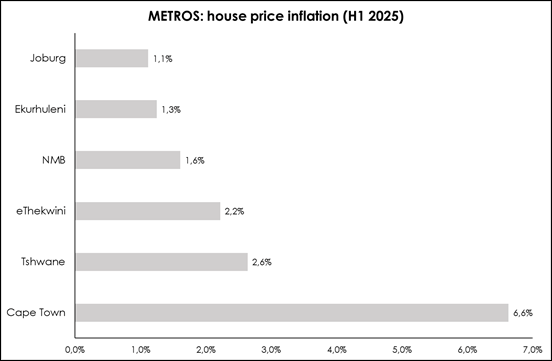
SOURCE: Lightstone
Sales in upper price bands rise, even as total sales activity declines
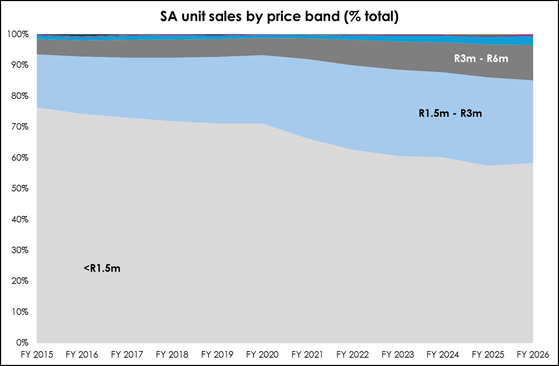
Having peaked in 2022, total residential property sales activity over the past decade (financial year 2015 to FY 2025) has declined, almost entirely due to a reduction in sales in the price band below R1.5 million.
SOURCE: Deeds Office
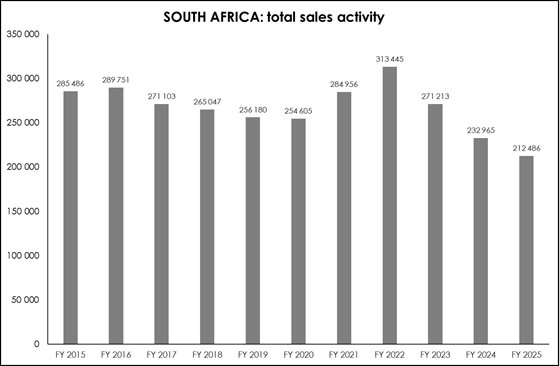
SOURCE: Deeds Office
Adds Dr Golding: “However, even as the overall number of homes sold has declined, mainly attributable to the decline in homes priced below R1.5 million, in certain price bands – including the upper bands – the actual number has risen. There has been a marked increase in the actual number of homes sold in the R1.5 million – R3 million and the R3 million – R6 million price bands. Representing smaller markets, the price bands from R6 million – R12 million, R12 million – R20 million, and R20 million – R35 million, have also registered an increase in units sold.”
| total units | FY 2015 | FY 2025 | change | Change % |
| <R1.5m | 217 942 | 121 878 | -96 064 | -44.1 |
| R1.5m – R3m | 48 941 | 60 999 | +12 058 | +24.6 |
| R3m – R6m | 14 390 | 22 580 | +8 190 | +56.9 |
| R6m – R12m | 3 221 | 5 287 | +2 066 | +64.1 |
| R12m – R20m | 517 | 938 | +421 | +81.4 |
| R20m – R35m | 180 | 733 | +553 | +307.2 |
| R35m+ | 295 | 71 | -224 | -75.9 |
| TOTAL | 285 486 | 212 486 | -73 000 | -25.6 |
For further information visit www.pamgolding.co.za
Posted by The Know - Pam Golding Properties

Housing market recovery builds momentum
Wednesday 1st of October 2025

Unchanged repo rate unlikely to stall housing market momentum
Thursday 18th of September 2025

Gauteng population growth boosts housing demand
Monday 25th of August 2025