In value, residential building plans now account for 53% of all building plans passed
 Dr Andrew Golding, chief executive of the Pam Golding Property group
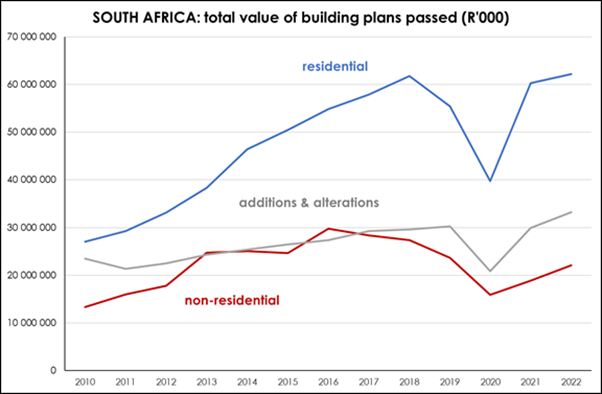
Metrics recently released by Statistics SA, indicate that in 2022 the total value of residential building plans passed in South Africa had recovered to its pre-Covid record, albeit in nominal terms rather than in real terms.
While the value of all building plans passed nationally rose by 84.1% between 2010 and 2022, during the same period the total value of residential plans more than doubled, increasing by +129.8% to R62 191 million last year. This compared with a more modest increase in the value of non-residential building plans (including office, retail, industrial, religious and educational buildings), which rose by +66.2% to R22 108 million, and a +41.5% increase to R33 189 million in building plans for alterations and additions.
| (Rm) Value | Residential | Non-residential | Alterations & additions | TOTAL |
| 2010 | 27 061 | 13 303 | 23 450 | 63 814 |
| 2022 | 62 191 | 22 108 | 33 189 | 117 487 |
| Change % | +129.8 % | +66.2 % | +41.5 % | +84.1 % |
SOURCE: Statistics SA
As a result of the robust increase in the value of residential building plans passed over the past 12 years, this sector now accounts for more than half of the total value of building plans passed nationally – up from 42% in 2010 to 53% in 2022. With residential plans passed accounting for a larger portion of total plans passed, the percentage of both non-residential and, more notably, alterations and additions declined (see table below).
| Composition: Value | Residential | Non-residential | Alterations & additions | Total |
| 2010 | 42% | 21% | 37% | 100% |
| 2022 | 53% | 19% | 28% | 100% |
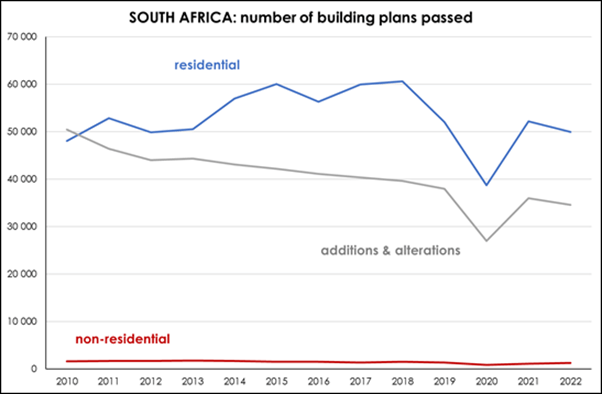
In terms of units , the residential building sector outperformed once again – even though the total number of residential plans passed in 2022 rose by just +3.9% compared to 2010 levels. In contrast, non-residential plans passed decreased by -19.7%, while the number of alterations and additions slumped by nearly a third (-31.5%) during the same period. Residential building plans passed now account for 58% of the total number of plans passed nationally, compared with 48% in 2010. (See Composition table below.)
| Number of building plans passed | Residential | Non-residential | Alterations & additions |
| 2010 | 48 087 | 1 656 | 50 454 |
| 2022 | 49 949 | 1 329 | 34 565 |
| Change (number) | +1 862 | -327 | -15 889 |
| Change % | +3.9 % | -19.7 % | -31.5 |
SOURCE: Statistics SA
| Composition: Units | Residential | Non-residential | Alterations & additions | Total |
| 2010 | 48% | 2% | 50% | 100% |
| 2022 | 58% | 2% | 40% | 100% |
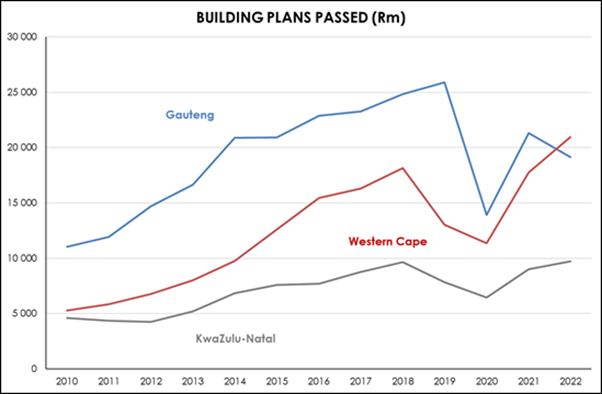
Notably, just over 80% of the value of residential building plans passed last year (2022) were in the Western Cape, Gauteng and KwaZulu-Natal. While only accounting for 6% of the total value of building plans passed last year, the Eastern Cape has seen significant growth in value of +218.7% during the past 12 years – one of only three regions registering growth of over 200% during this period. The Free State registered the lowest increase (+12.5%) in the value of residential building plans passed last year relative to 2010 (see table below).
| RESIDENTIAL
value per region |
Value building plans passed 2022 (Rm) | Growth in value
2010 – 2022 |
2022 value building plans passed % SA |
| Western Cape | 20 947 | +296.6 | 33.7 |
| Gauteng | 19 129 | +73.1 | 30.8 |
| KwaZulu-Natal | 9 715 | +111.0 | 15.6 |
| Eastern Cape | 3 753 | +218.7 | 6.0 |
| Mpumalanga | 2 782 | +88.3 | 4.5 |
| North West | 2 213 | +74.2 | 3.6 |
| Limpopo | 1 823 | +111.8 | 2.9 |
| Free State | 1 344 | +12.5 | 2.2 |
| Northern Cape | 484 | +248.9 | 0.8 |
| National | 62 191 | +129.8 | 100 |
The Western Cape accounted for just over a third (33.7%) of all residential plans passed in SA last year, followed closely by Gauteng (30.8%). However, the robust growth in the value of residential plans passed in the Western Cape relative to Gauteng suggests that the Western Cape will increasingly dominate the new residential housing market in the years ahead.
SOURCE: Statistics SA
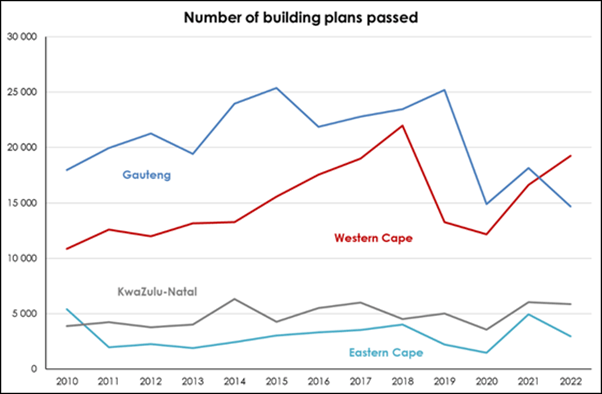
In terms of units, the Western Cape, Gauteng and KwaZulu-Natal account for 79.7% of all residential building plans passed in 2022. In 2010 they accounted for just 68.1% of all plans passed – suggesting that there has been a concentration of residential building activity in these three regions. (See table below.)
Once again, the Western Cape tops the list with the largest share of residential building plans passed and the second-highest increase over the past decade. Interestingly, the number of plans passed in the Western Cape declined sharply before Covid, fell further during the pandemic, but then rebounded strongly, quite possibly fuelled by the strong semigration trend.
Gauteng, which accounts for the second-largest number of residential building plans passed, was experiencing strong growth untilCovid, but has since failed to recover from the impact of the pandemic and passed fewer residential building plans in 2022 than in 2010.
While KZN remains in distant third spot it has registered a solid 51.1% increase in the number of residential plans passed since 2010 and a more than doubling (128.7%) in the value of plans passed over the same period.
| RESIDENTIAL
units per region |
# building plans passed 2022 | Growth in units
2010 – 2022 (%) |
2022 # building plans passed % SA |
| Western Cape | 19 250 | +77.0 | 38.5 |
| Gauteng | 14 702 | -18.2 | 29.4 |
| KwaZulu-Natal | 5 881 | +51.1 | 11.8 |
| Eastern Cape | 2 961 | -45.2 | 5.9 |
| Limpopo | 2 610 | +122.3 | 5.2 |
| North West | 1 726 | -38.0 | 3.5 |
| Mpumalanga | 1 569 | -36.7 | 3.1 |
| Free State | 1 007 | -69.0 | 2.0 |
| Northern Cape | 243 | -6.9 | 0.5 |
SOURCE: Statistics SA
Posted by The Know - Pam Golding Properties

Housing assets reflect a further recovery in price appreciation
Thursday 5th of June 2025

Very welcome interest rate relief for consumers – including home buyers and mortgage applicants
Thursday 29th of May 2025

Majority of first-time buyers still purchase freehold homes
Friday 16th of May 2025